
DataTalk
DataTalk features an intuitive, AI-powered interface that allows you to interact with your campaign data using natural language. From the main dashboard, you can seamlessly navigate between asking new questions and reviewing your past interactions.
Discover the Power of Conversational Analytics Driven by Google AI
The indigitall engine is built to do more than answer questions; it is designed to interpret human intent. By leveraging Gemini for the semantic interpretation of complex queries and utilizing refined prompt engineering, our system transparently translates natural language into sophisticated SQL. This allows the AI to reason through the semantics of your metrics before delivering a single result.
1) Starting a New Query
To ask the AI Assistant a new question, click on New query in the left main menu.
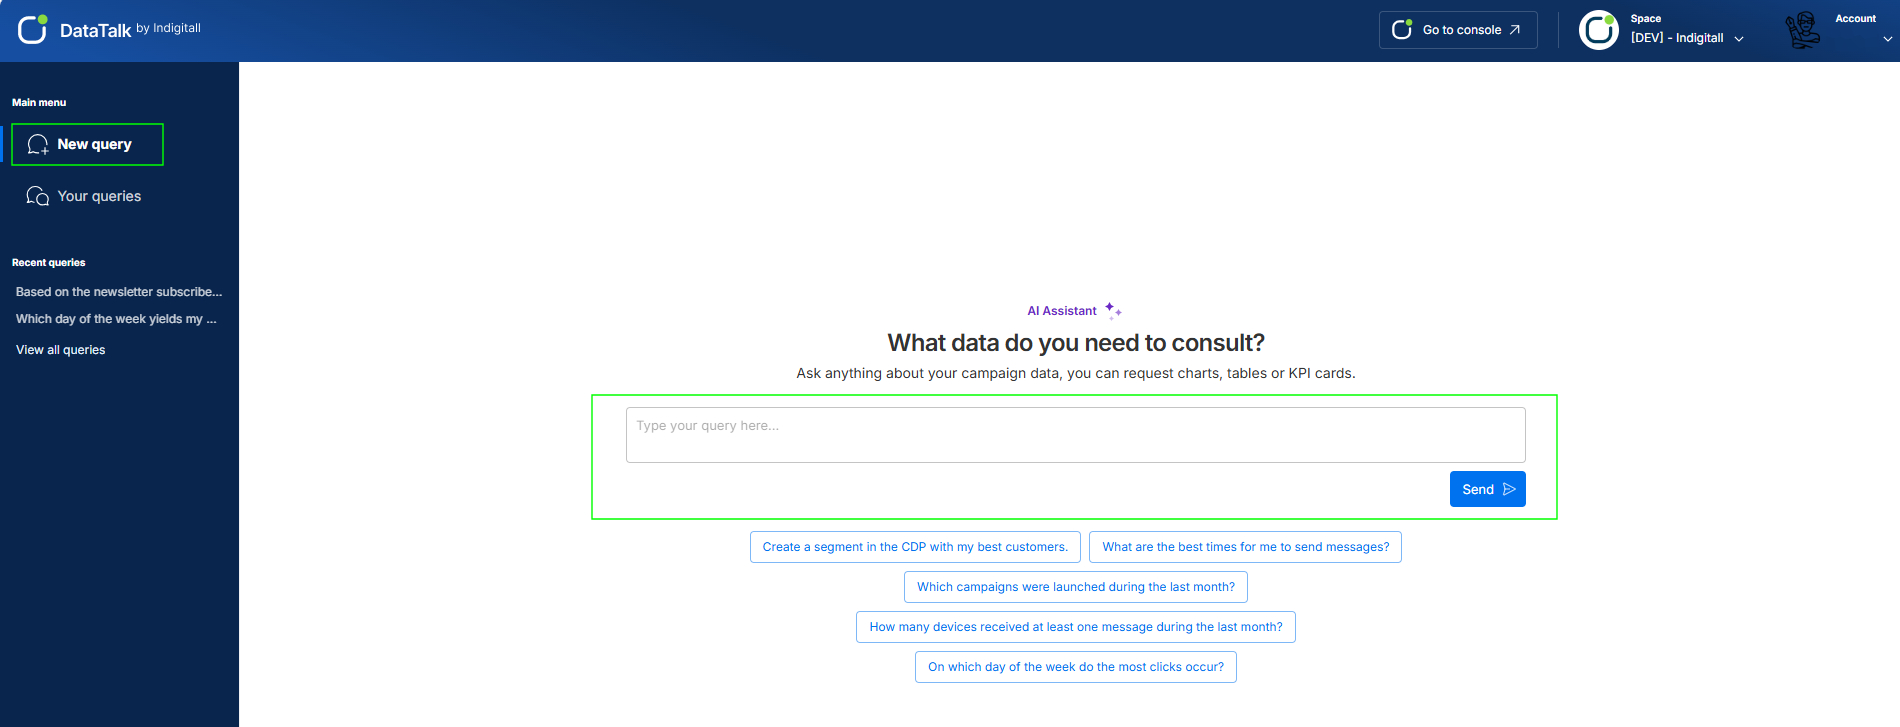
This screen is your primary workspace for data exploration.
- The Input Box: At the center of the screen, you will find a text box where you can type your prompts. You can ask anything regarding your campaign data, and even request the output format to be displayed as charts, tables, or KPI cards.
- Sending your prompt: Once you have typed your request (for example, "Which day of the week yields my best results..."), simply click the blue Send button.
- Suggested Queries: If you aren't sure where to start, the platform provides several pre-written suggestion bubbles below the text box (e.g., "Which campaigns were launched during the last month?"). Clicking on any of these will automatically populate the query box.
2) Reviewing Your Query History
If you need to revisit data you previously requested, click on Your queries in the left main menu.
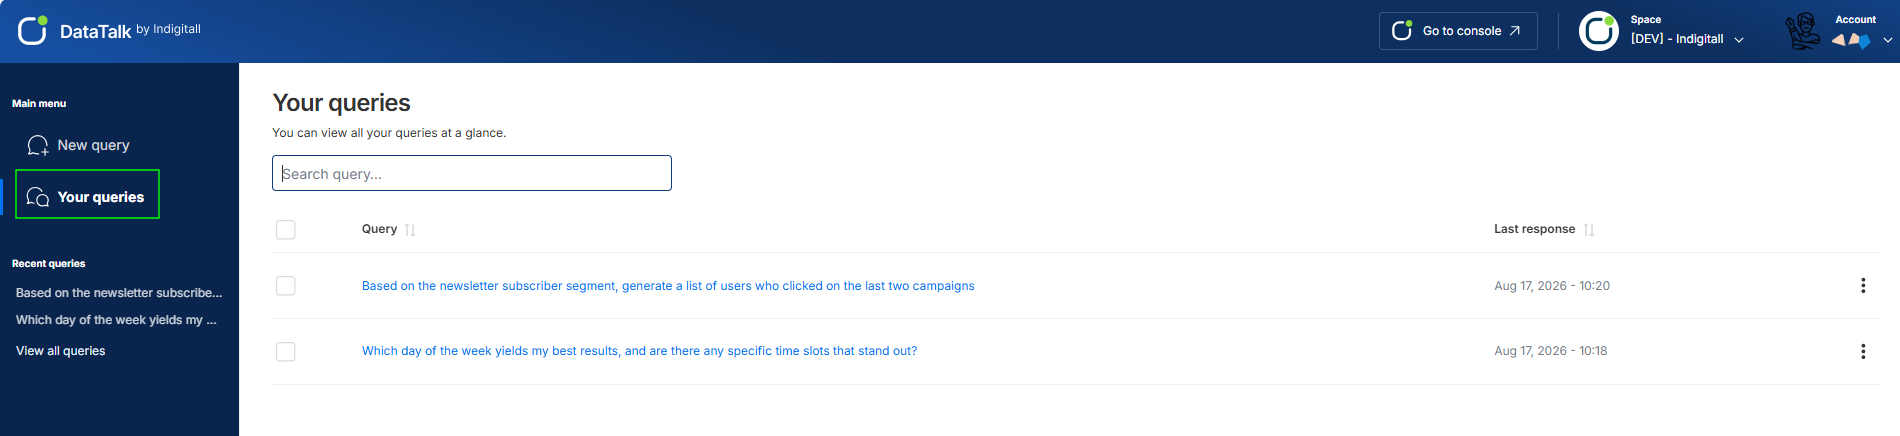
This section acts as your personal historical log, allowing you to view all your previous interactions at a glance.
- Search Functionality: At the top of the page, there is a Search query bar. You can use this to quickly find a specific prompt without having to scroll through your entire history.
- Query Table: Your past queries are organized in a clear list format.
- The Query column shows the exact text prompt you submitted.
- The Last response column shows the exact date and time (timestamp) when the AI generated the data for you.
3) Session Continuity
DataTalk is designed to protect your workflow. The platform now automatically saves your entire conversation history in the sidebar under Recent queries and creates a dedicated save point if your session expires, allowing you to pick up your analysis exactly where you left off.
Key benefits to your workflow
- History always at hand: You can directly access your previous analyses from the sidebar menu (Recent queries). This lets you review past responses instantly without having to run the same prompt from scratch.
- Continuity with no lost work: If your session times out due to inactivity or you accidentally close your browser, Data Talk remembers the exact point of your conversation. All your applied parameters, filters, and values are safely stored.
- Seamless user experience: When you log back in, the tool fully recovers the contextual thread of your conversation. This prevents frustration and optimizes day-to-day operations for your analysts and campaign managers.
High-Performance Infrastructure on GCP
Our entire operational flow runs natively on Google Cloud Platform (GCP). We query BigQuery directly to process massive data volumes from multiple channels (SMS, Push, Email) in real time. This eliminates latency and ensures your information is always fresh.
Visualization and Actionable Insights
Move from raw data to visual clarity in seconds. DataTalk provides more than just text; it instantly generates tables and charts to visualize your results. Convert those insights into ready-to-use segmented audiences, saving hundreds of hours of manual labor and eliminating the need for technical support tickets.
Key Advantages of DataTalk
- In-Depth Analysis: Enables you to query and visualize data with a high level of granularity and detail.
- Cost Savings: Powered by indigitall’s included tokens, so it won't consume your company’s own token balance or API credits.
- Targeted User Segmentation: Allows you to run custom queries or prompts to build precise, actionable user segmentations.
- Visual Data Representation: Presents data intuitively through clear charts and graphical formats.
Updated 25 days ago