
Automated Performance Reports
Stay on top of your metrics with our highly visual automated reports. These summaries are delivered directly to your inbox on a weekly or bi-monthly basis, depending on your active services and configuration.
The report provides a snapshot of your project's health, divided into three key sections: Activity, Chatbot, and Contact Center.
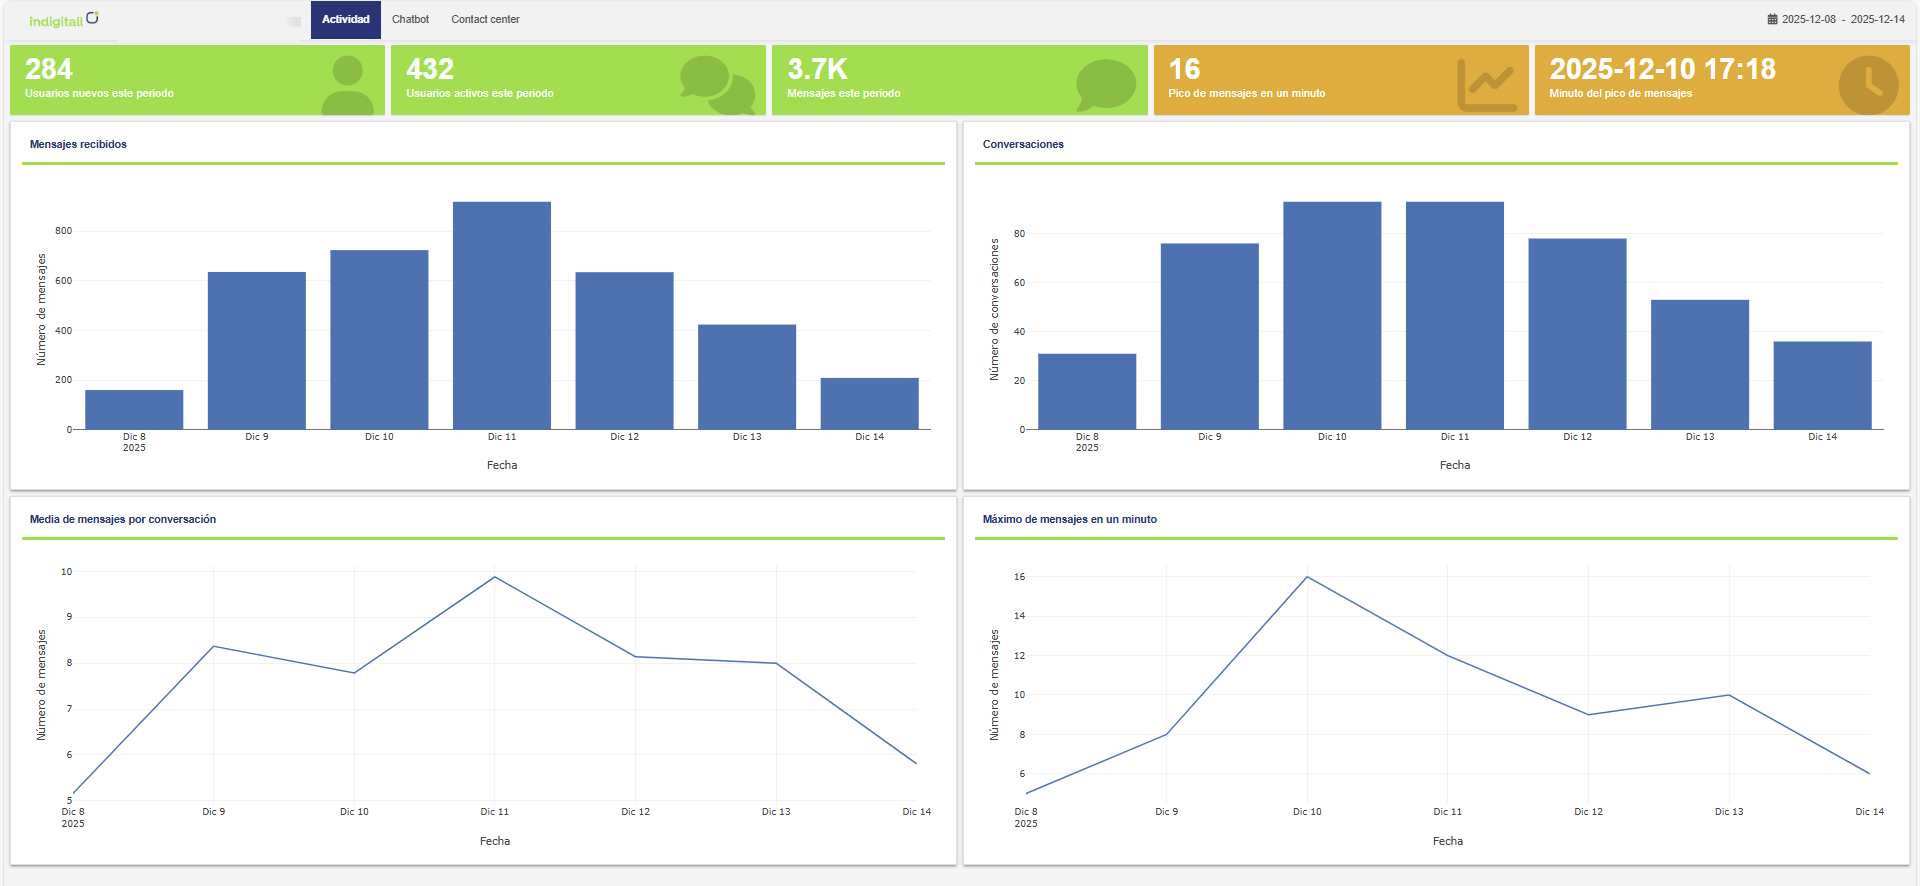
Activity Overview
This section provides a high-level look at user engagement and system throughput.
Key Metrics:
- New Users: Total number of first-time users during this period.
- Active Users: Total number of users who interacted with the platform during this period.
- Total Messages: The aggregate volume of messages processed.
- Peak Volume (RPM): The highest number of messages processed in a single minute.
- Peak Time: The specific timestamp (minute) when the peak volume occurred.
Visual Charts:
- Incoming Messages: Volume trend of messages received.
- Conversations: Total number of distinct conversation threads.
- Average Messages per Conversation: A gauge of interaction depth.
- Max Messages per Minute: A graph showing throughput spikes.
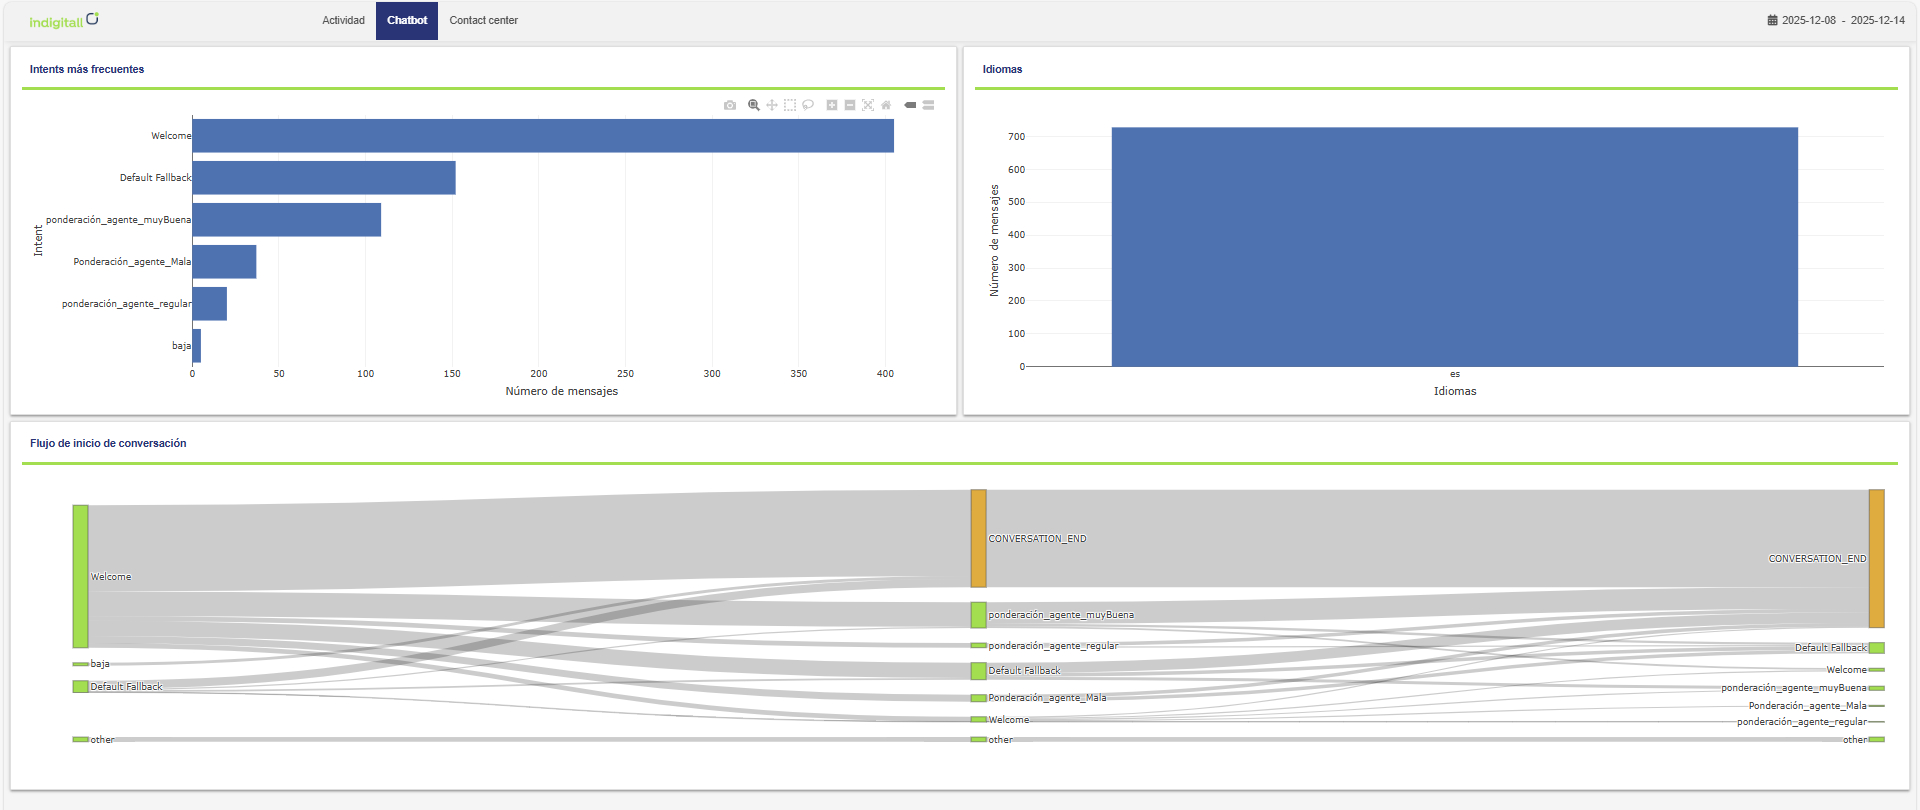
Chatbot Analytics
Gain insights into how your automated assistants are performing and what your users are asking.
Visual Charts:
- Most Frequent Intents: A ranking of the most common user intentions/topics detected by the bot.
- Language Distribution: Breakdown of the languages used by your users.
- Conversation Start Flows: Visualizing the entry points and how conversations typically begin.
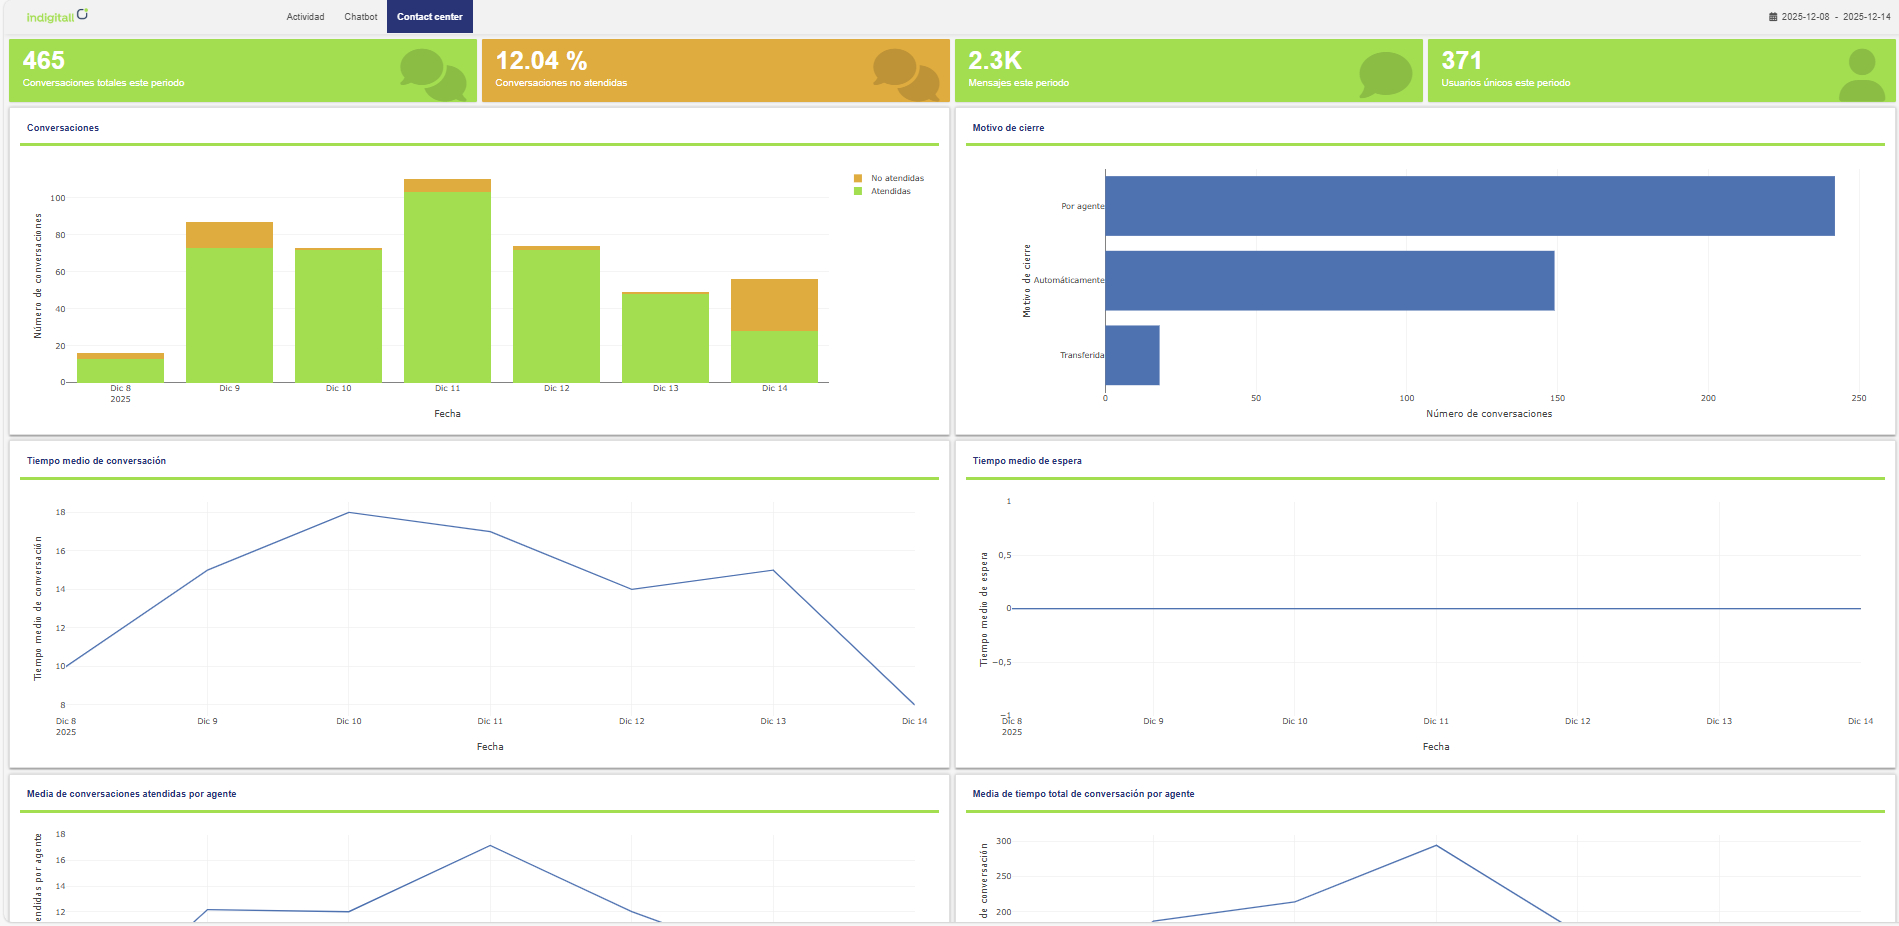
Contact Center Metrics
Detailed performance data regarding your human support team and conversation handling.
General Summary:
- Total Conversations: This is a cumulative count of all assignments, not a count of unique users. It represents every conversation initiated, transferred, or unanswered on the platform; each transfer is counted as a new assignment. This includes all interactions handled by any role (Support, Admin, or Tech).
- Missed Conversations: Conversations that were not picked up by an agent.
- Total Messages: Volume of messages exchanged within the Contact Center.
- Unique Users: Distinct individuals served during this period.
Operational Graphs:
- Handled vs. Missed: A visual comparison of service levels.
- Closing Reasons: Breakdown of how and why tickets/chats were closed.
- Average Conversation Time: The average duration of a support interaction.
- Average Wait Time: How long users waited before an agent replied.
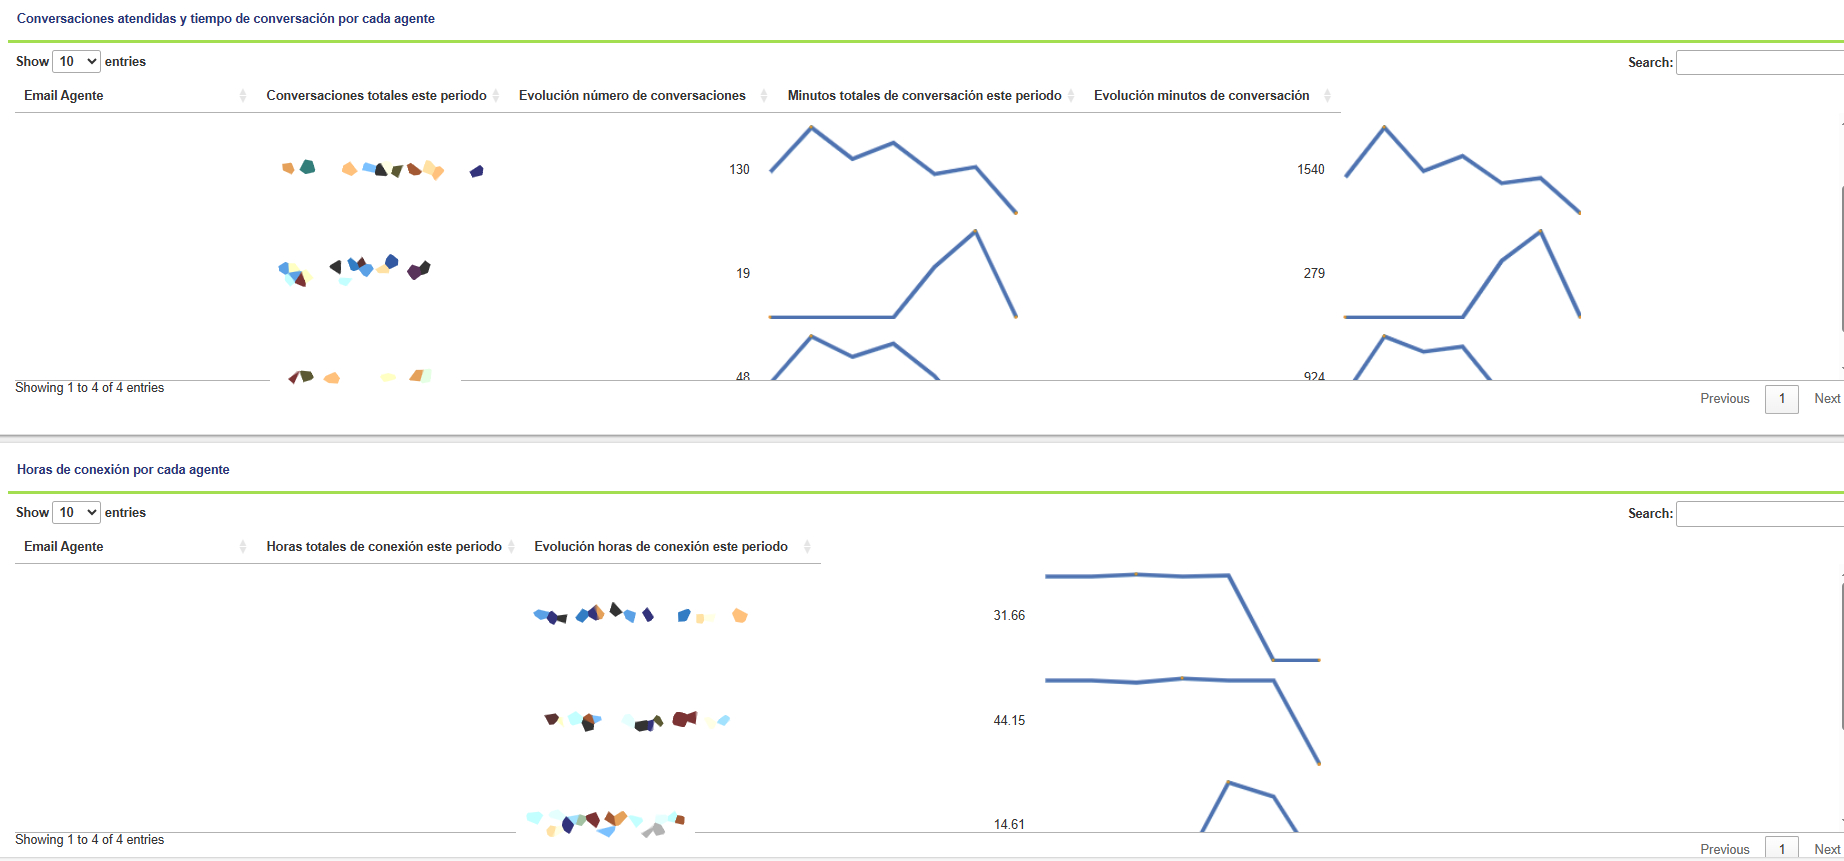
Agent Performance:
- Conversations per Agent: This metric represents the number of conversations managed by specific agents.
- Evolution of Number of Conversations: A curved line graph plotting daily conversation volume.
- Total Conversation Minutes: Cumulative talk time per agent.
- Conversation Minutes Evolution: A curved line graph showing daily conversation duration.
- Total Connection Hours: Total hours per agent spent logged into the platform.
- Connection Hours Evolution: A curved line graph plotting daily connection hours.
Do not expect the sum of individual agent stats to equal the Total Conversations figure. The Agent metric specifically measures the agent effort required to move those leads through the funnel.
- Automated Resolution: Many conversations are resolved by the bot or technical triggers without ever being assigned to a human agent.
- The Transfer Distinction: Total Conversations accurately track every transfer as a new, unique conversation event. This ensures that each departmental hand-off, whether to technical, sales, or management, is recorded as a distinct interaction, reflecting the true volume of activity beyond the initial lead entry.
Updated 5 months ago