
Statistics
The marketers need the analysis of real-time data so we have developed a powerful analytical tool that allows full access to data.
SDKs updatesCustomer Journey Statistics may not display correctly for SDKs that do not have at least version [4.12.3] on native iOS and [4.17.3] on Android.
Simplified data analysis
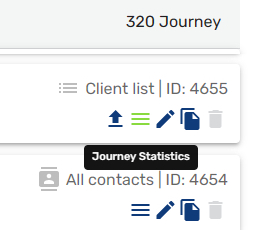
In the Customer Journey area, you can see all statistics of each Customer Journey clicking on the three horizontal dashes icon.
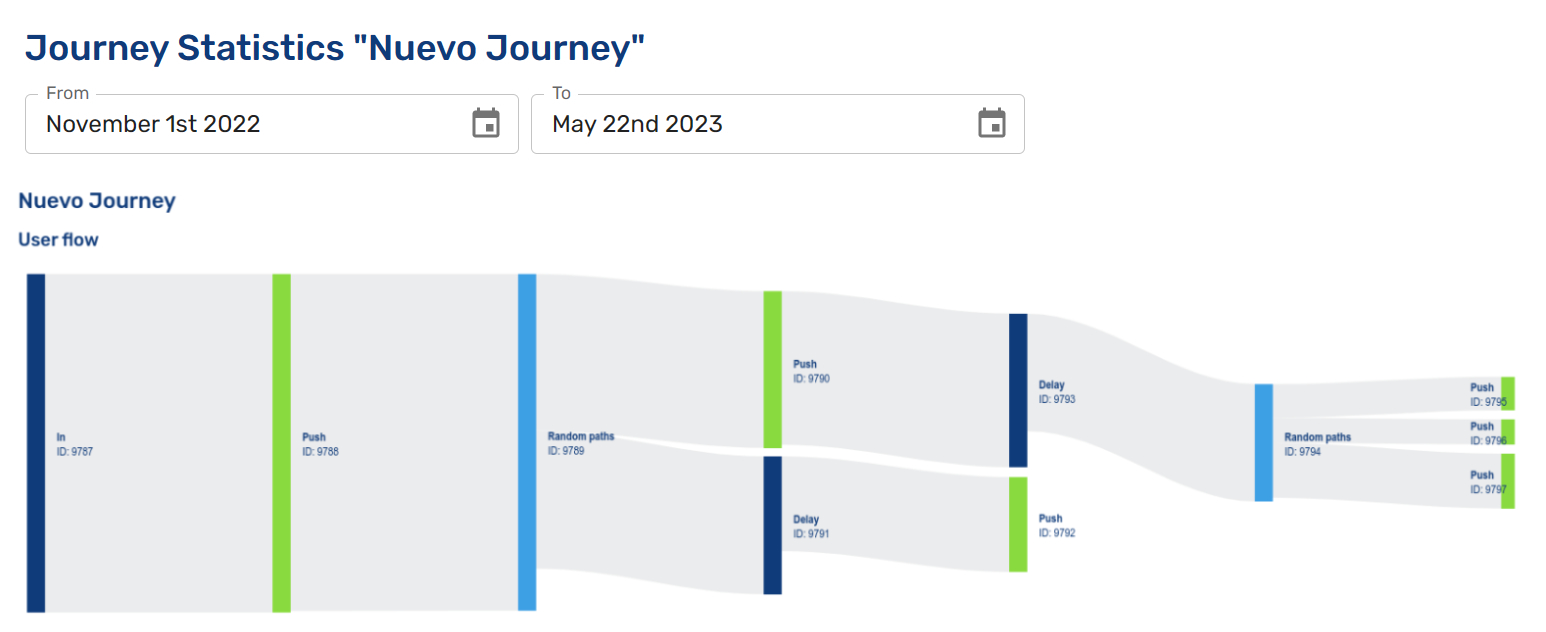
Then you can choose the time interval to see the User Flow and the parameters for each node.
User Flow
The user flow graph indicates how many users have completed the events (nodes) of the Customer Journey. It only shows the users who have entered into Customer Journey between the selected dates.
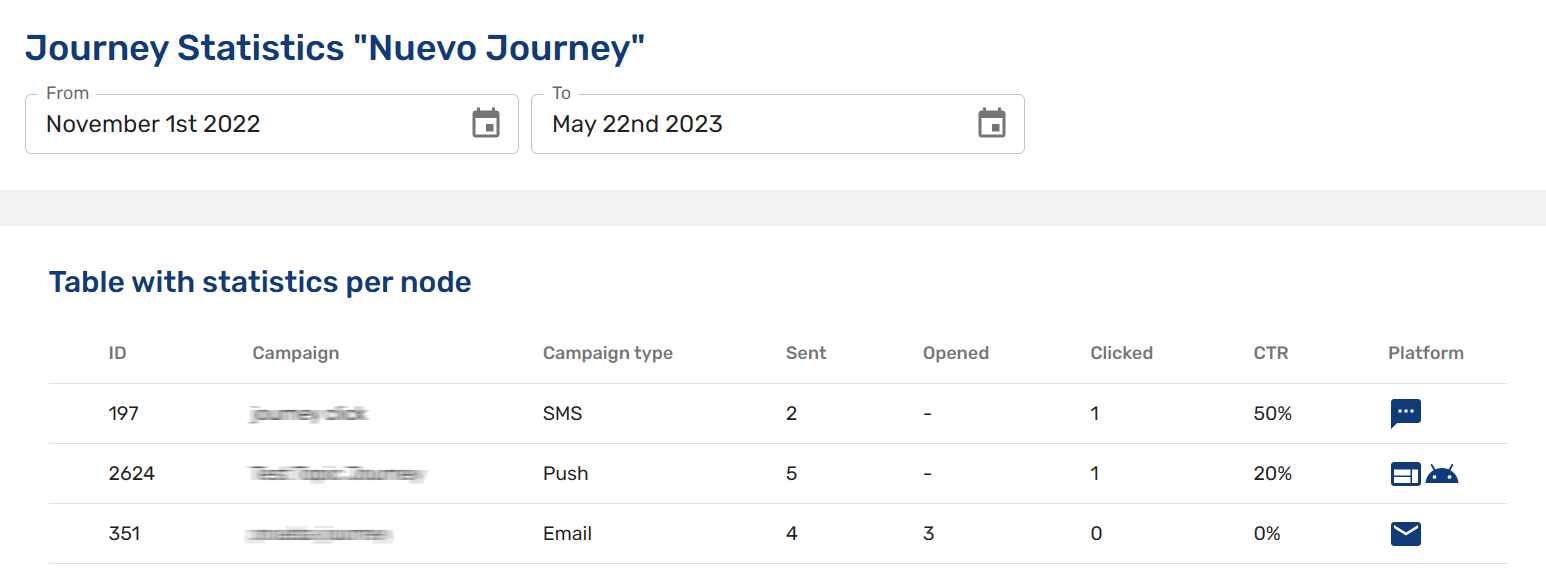
Statistics per node
indigitall gives you the following parameters for each event/node. This table only shows the events occurred between the two selected dates:
- ID: Identifier of the node campaign.
- Campaign: Name of the node campaign.
- Campaign type: Channel used for the node.
- Sent: Number of communications sent.
- Opened: Number of emails opened by users (SMS and push notifications don't apply).
- Clicked: Number of communications clicked by users.
- CTR: Click-through rate is the ratio of users who clicked on it in relation to the number of total communications sent.
- Platform: It displays an image icon to describe the platform. For example, for the channel of email and SMS, the platform is the same (email icon and SMS icon) while for the push campaign type, the platform changes: Web icon, iOS icon and/or Android icon.
Important Note on Email Open Metrics
When analyzing email performance within a Customer Journey, keep in mind that an "Opened" status can be influenced by technical factors. Privacy features (such as Apple MPP) and security firewalls often trigger automatic "false opens" by pre-loading tracking pixels, while image blocking can prevent valid opens from being recorded. For the most accurate assessment of user behavior and true engagement in your journeys, always analyze Click Rates alongside your open metrics.
Understanding email statuses is key to mastering your deliverability strategy.
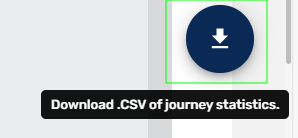
Downloading Reports
A new downloadable report is now available in CSV format with Customer Journey data by customer. You’ll find a downward arrow icon on the right side of each report. Click it to download the CSV file containing the following data.
-
application_id: Identifier of the channel assigned by indigitall.
-
journey_id: Identifier assigned by indigitall to the customer journey.
-
journey_name: Name assigned to the customer journey by the client.
-
journey_state_id: Identifier of the journey node assigned by indigitall.
-
journey_state_name: This column identifies the specific type of node or state a user is currently in (or has passed through) within a Customer Journey. The options are categorized by their function: Entry Sources (IN), Flow Logic (FLOW), Actions (ACTION_), and Exits (OUT).
Entry Sources (Triggers). These states represent how users enter the journey:
IN_ALL: The journey is triggered for the entire user database (all contacts).
IN_FILTER: The journey starts for users who meet a specific set of filter criteria (e.g., specific device, location, or user property).
IN_SEGMENT: The journey starts for users belonging to a pre-defined Segment.
IN_LIST: The journey starts for users included in a specific static list (e.g., a file import).
IN_CUSTOM_EVENT: The journey is triggered in real-time when a user performs a specific Custom Event (e.g., "Purchase Completed", "Login").
Actions (Messaging & Integration). These states represent an action taken by the platform to communicate with the user or an external system:
ACTION_PUSH_SEND: A Push Notification (Web or App) is sent to the user.
ACTION_EMAIL_SEND: An Email is sent to the user.
ACTION_SMS_SEND: An SMS message is sent to the user.
ACTION_CHAT_SEND: A Chat message (e.g., WhatsApp, Messenger) is sent to the user.
ACTION_WEBHOOK: A Webhook is triggered to send data to an external server or API.
ACTION_DELAY: A "Wait" step where the user is paused for a specified duration before moving to the next step.
Flow Logic (Control & Decisions). These states represent decision points, checks, or logic gates that determine the user's path:
FLOW_FILTER: A decision node that checks if the user meets specific criteria. Users may be routed differently based on whether they match the filter (Yes/No).
FLOW_RANDOM: A split node that distributes users randomly across different paths. Commonly used for A/B testing or control groups.
FLOW_BEST_PATH: An AI-driven node that automatically determines the optimal path for each user (e.g., the channel most likely to convert).
FLOW_CUSTOM_EVENT: A wait or decision node checking if a user performs a Custom Event within a certain timeframe.
FLOW_PUSH_CLICK: A specific check to see if the user clicked on a previously sent Push Notification.
FLOW_EMAIL: A decision node based on Email interaction (e.g., checking if an email was Opened, Clicked, or Bounced).
FLOW_SMS: A decision node based on SMS interaction (e.g., Delivery status or Link Click).
FLOW_CHAT: A decision node based on Chat interaction (e.g., Read receipt or Reply).
Exits: OUT: The final state indicating the user has completed the journey and exited the flow.
-
campaign_name: Name of the campaign, if applicable.
-
customer_id: User identifier assigned by indigitall within a customer journey.
-
external_code: External reference code.
-
reentry_number: Reentry count.
-
event: Type of event, such as an open or click (it will be empty if it is an out node).
-
event_at: Date and time of the event (it will be empty if it is an out node).
Updated 2 months ago