
inApp/inWeb Statistics
You can access your statistics from the side menu of your indigitall console: Statistics > In app/web.
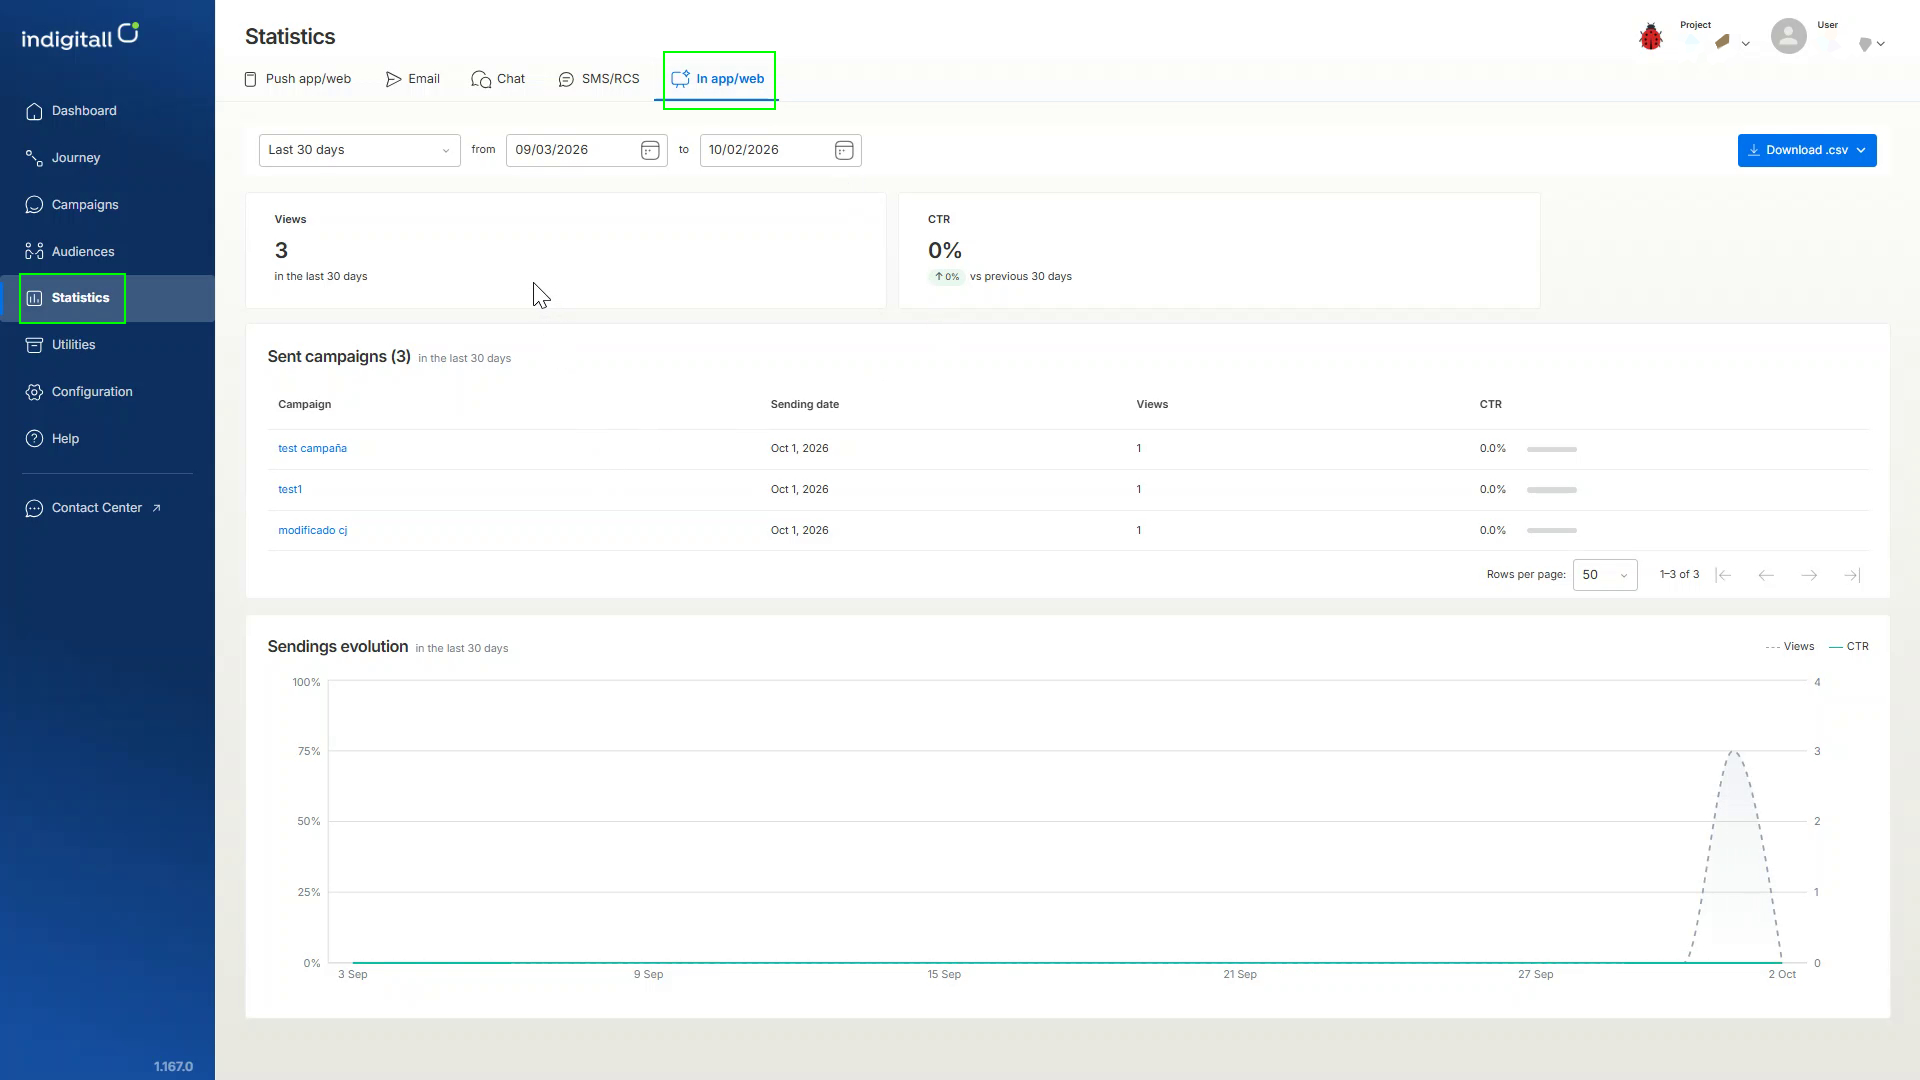
KPIs
| Card | Description |
|---|---|
| Views | Number of times the in-app/in-web messages were displayed in the period. |
| CTR | Click-through rate: percentage of views that resulted in a click. Includes the comparison with the previous period. |
Sent campaigns
| Column | Description |
|---|---|
| Campaign | Campaign name. Click it to open the campaign. |
| Sending date | Date of the sending. |
| Views | Number of views. |
| CTR | Click-through rate of the campaign. |
Sendings evolution
Daily chart with two metrics: Views (dashed line) and CTR.
Download the CSV files

- Click Download .csv.
- Choose one of the options:
- Download .CSV of statistics by day
- Download .CSV of statistics with device data
- Download .CSV of statistics by campaign
Statistics by day
One row per day with activity.
| Field | Description |
|---|---|
date | Day the data refers to. |
numContactsPrint | Number of views (impressions) of the messages. |
numContactsClicked | Number of clicks on the messages. |
Statistics with device data
| Field | Description |
|---|---|
campaignId | Campaign ID. |
name | Campaign name. |
createdDate | Date and time the campaign was created (UTC). |
schemaId | ID of the in-app/in-web schema (format) used by the campaign. |
contentFile | Identifier of the content file of the message. |
properties | Display properties of the message, in JSON format (for example, showTime). |
filters | Filters applied to the campaign, in JSON format (for example, the target platforms). |
numContactsPrint | Number of views (impressions). |
numContactsClicked | Number of clicks. |
Updated 13 days ago
Did this page help you?